Oldest human record not broken for 28 years – are we making any progress with maximum lifespan?
Will Jeanne Calment’s record 122 years ever be broken?
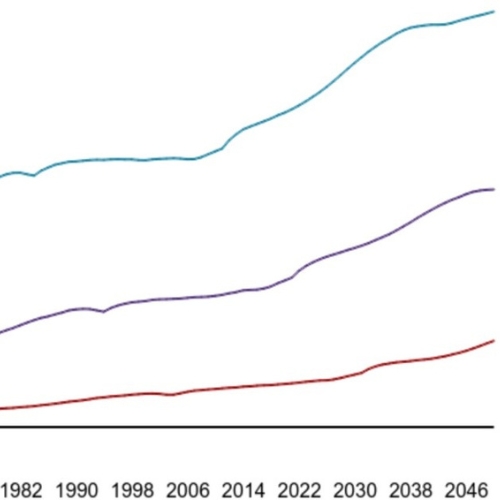
I found some UK statistics from the UK government’s Office for National Statistics recently – they were prepared for the Department of Work and Pensions to determine how much the government needs to put by in pensions. (If you want to skip the statistics and just want to know when you might live forever, feel free to jump to the last paragraph now!) These statistics are particularly interesting as they look at life expectancy when a person is already aged 65 – so they avoid the big impacts on life expectancy “at birth” statistics from the 20th century including better child birth care, antibiotics and the world wars.
Up until the last few years not only has there been a steady increase in life expectancy at 65, but also a steady increase in the rate it is increasing. To make it easier to see, I’ve not plotted the life expectancy but the year-on-year increase in life expectancy when aged 65. That’s the red line on the graph, smoothed out with a 10 year trailing average (of average male & female life expectancy).
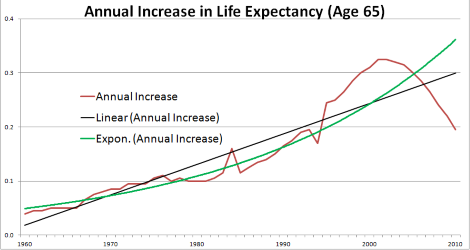
Using a standard linear trend line (in black) you can see a steady increase. Now what happens when the black line reaches 1.0? At that point people about to retire will start having their life expectancy increase by one year for every year they live*. So when will that be? Continuing the trend line shows indefinite life extension being reached in 2136.
But what about all the talk about exponential growth in medical technology? Oh yes! Don’t think I’d forgotten about that. Look at the green curve – this is a best fit exponential curve for the same data. Even with the recent trail off it still shows exponential growth. So when does this line reach 1.0? Much sooner – using the formula for the trend line Excel chucked back at me, this curve hits jackpot in 2036, a whole century sooner. So if you’re currently under 44 (in 2015) you’ll reach 65 just as life expectancy is increasing as fast as you’re living – welcome to immortality!
*OK in a year’s time you’re now 66 so not quite at the same point on the graph, but a couple of years later life expectancy will be increasing faster that time passes so this seems as good a point as any to say on average people will be living forever.
Data source: Cohort Estimates of Life Expectancy at Age 65
Click on resource name for more details.

Warts precision medicine got to do with it?
Apple releases its brain uploading service for immortality

Will Jeanne Calment’s record 122 years ever be broken?

Has this century seen extraordinarily long-lived Wimbledon champions, or are winners over 30 years of age the new normal?

Not as long as you might think. For radical life extension we need to reverse ageing.

The data and science behind the exponential growth in mortality with age

Health and life expectancy are affected by love, sex and marriage