Monitoring my blood glucose response with a Freestyle Libre 3 CGM
Continuous glucose monitors have become more popular recently, possibly for 2 main reasons. Firstly, the technology has advanced so much that the devices are cheap, discrete and can be applied by the user rather than needing an appointment with a clinician. Secondly, several companies, such as Zoe, have started promoting CGMs as a way to monitor your metabolic health. So, although I don’t have diabetes, I thought I’d give one a go.
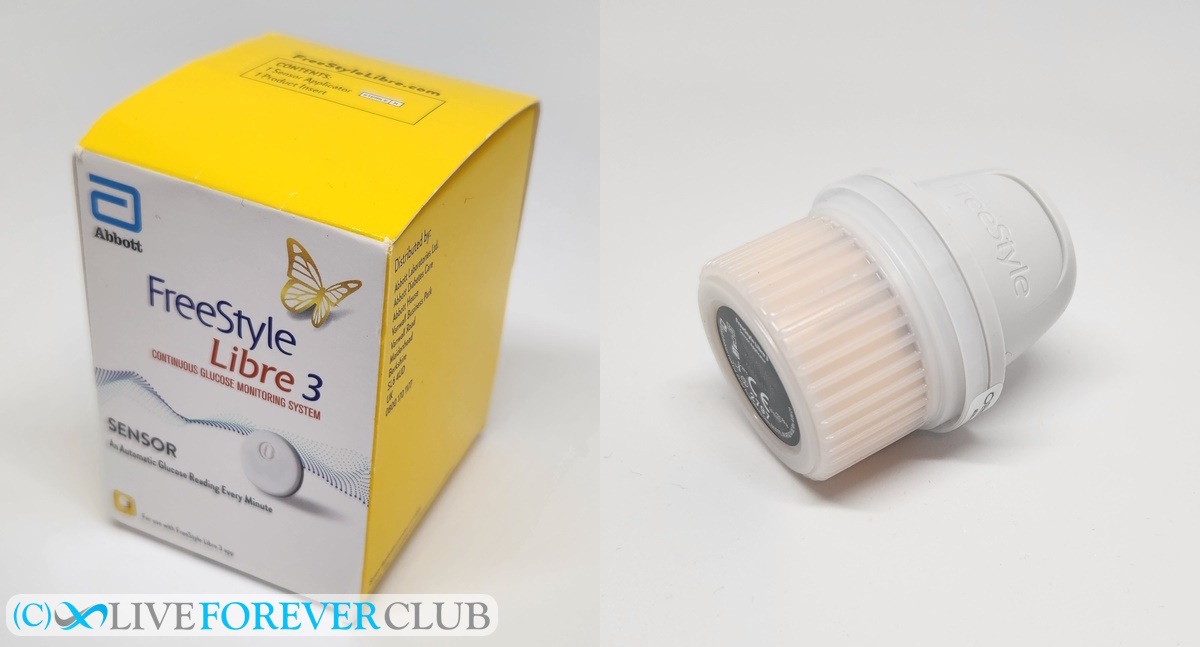
The full Zoe package was too expensive, so I found a pharmacy where I could purchase a Freestyle Libre 3 without a prescription for £ 65 (US$ 80). This CGM is manufactured by Abbott, a one hundred thousand plus staff medical device and health care company, so you can be sure it’s been designed and manufactured to a high standard – remember, the only thing worse than no data is bad data, don’t just go for the cheapest CGM you can find. I’ll try to put a comparison of these and other devices on the website soon.
What is a continuous glucose monitor?
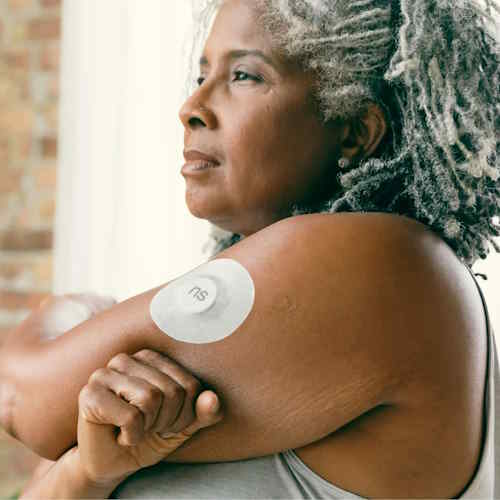
A continuous glucose monitor (CGM) is a device to measure glucose levels in real-time throughout the day and night. It is used primarily by individuals with diabetes but there is more interest recently from non-diabetics (and particularly prediabetics) to see how they personally respond to different food stuffs. This system typically consists of a small sensor attached to the body (abdomen or arm) which measures glucose levels in the interstitial fluid. The sensor transmits this information to a receiver (typically, nowadays, a smartphone), providing a continuous update on glucose levels.
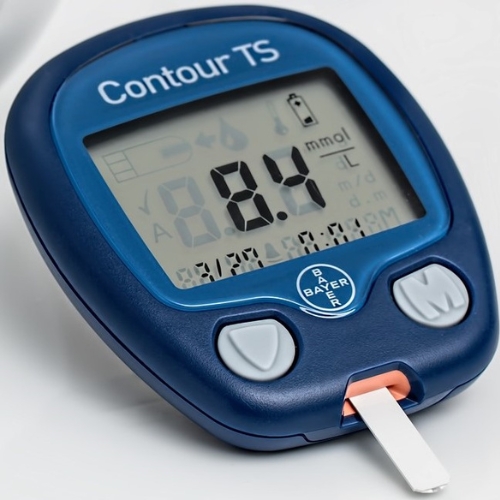
This ability to track trends and fluctuations in glucose levels wasn’t really possible with finger prick tests, the traditional method of measuring blood glucose levels. They are generally accurate and even provide more time-sensitive results - because CGMs measure interstitial fluid, rather than blood directly, and experience a 5 to 10-minute lag behind actual blood glucose levels.
In between these two options are flash glucose monitors (FGM), which, like CGMs, use a sensor placed on or under the skin. However, they do not send real-time data automatically. Instead, users must scan the sensor with a device to get the glucose reading. While they also reduce the need for finger pricks and provide trend information, they lack the real-time alerts that CGMs offer.
Freestyle Libre 3 CGM
Let’s have a look at the experience of using the device itself. It was all reasonably self-explanatory, and certainly if you were using one regularly it would be a very quick routine to change the detector once it had expired. Unlike some consumer-focused tests, which can come in very swish boxes, Abbott’s Freestyle Libre 3 CGM comes in a practical but unexciting box.
Applying the Freestyle Libre 3
The only contents are the device itself and the mandatory patient information leaflet. Surprisingly, although the instructions stipulate wiping the arm with an alcohol swab before applying, one wasn’t included in the box. Given they must cost pennies, or less than 0.1% of the purchase price, I feel that one should be part of the kit.
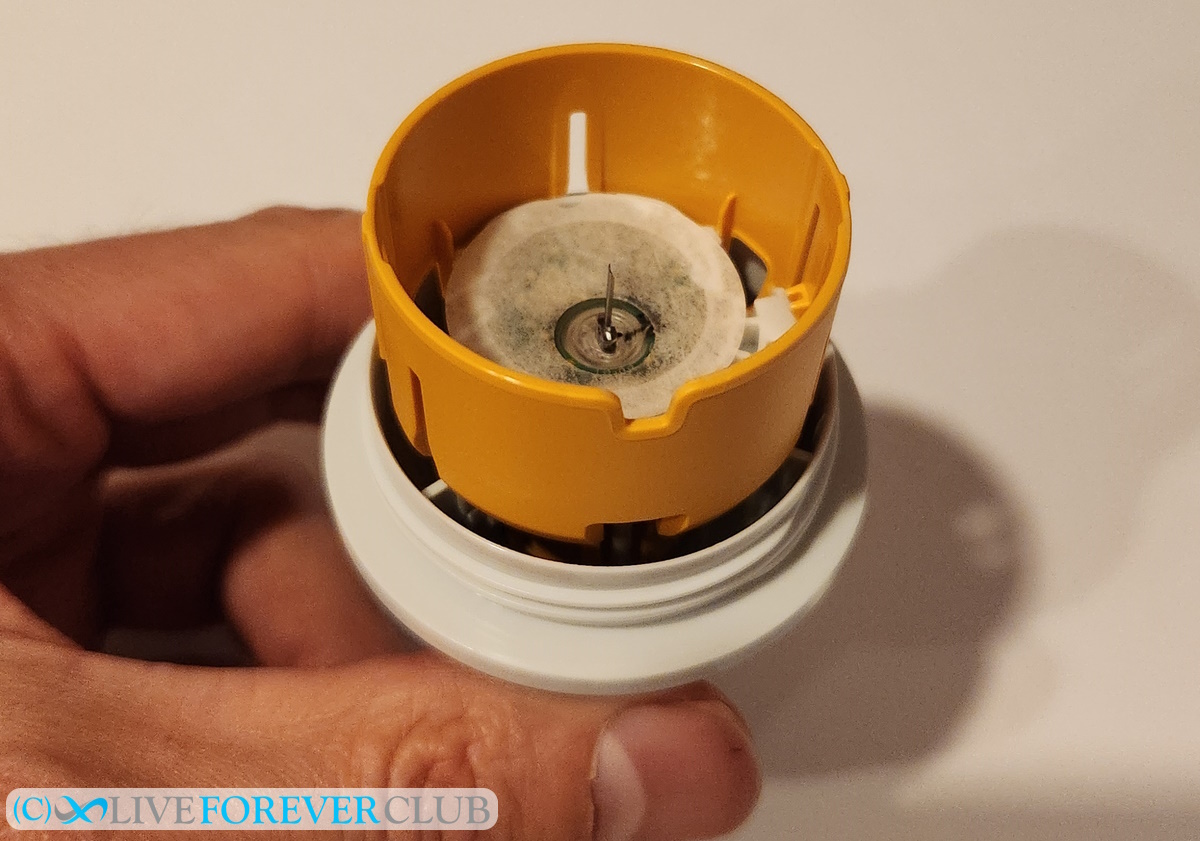
One piece of advice of the squeamish, or you’re not keen on needles… don’t look inside the applicator! As you can see in the photo below, the sensor-needle appears huge. It’s hard to imagine that this scary looking, drawing pin sized tack isn’t doing to hurt, but it really is painless. I barely felt it going in and I’m not a paid actor on the Zoe adverts that all say the same thing!
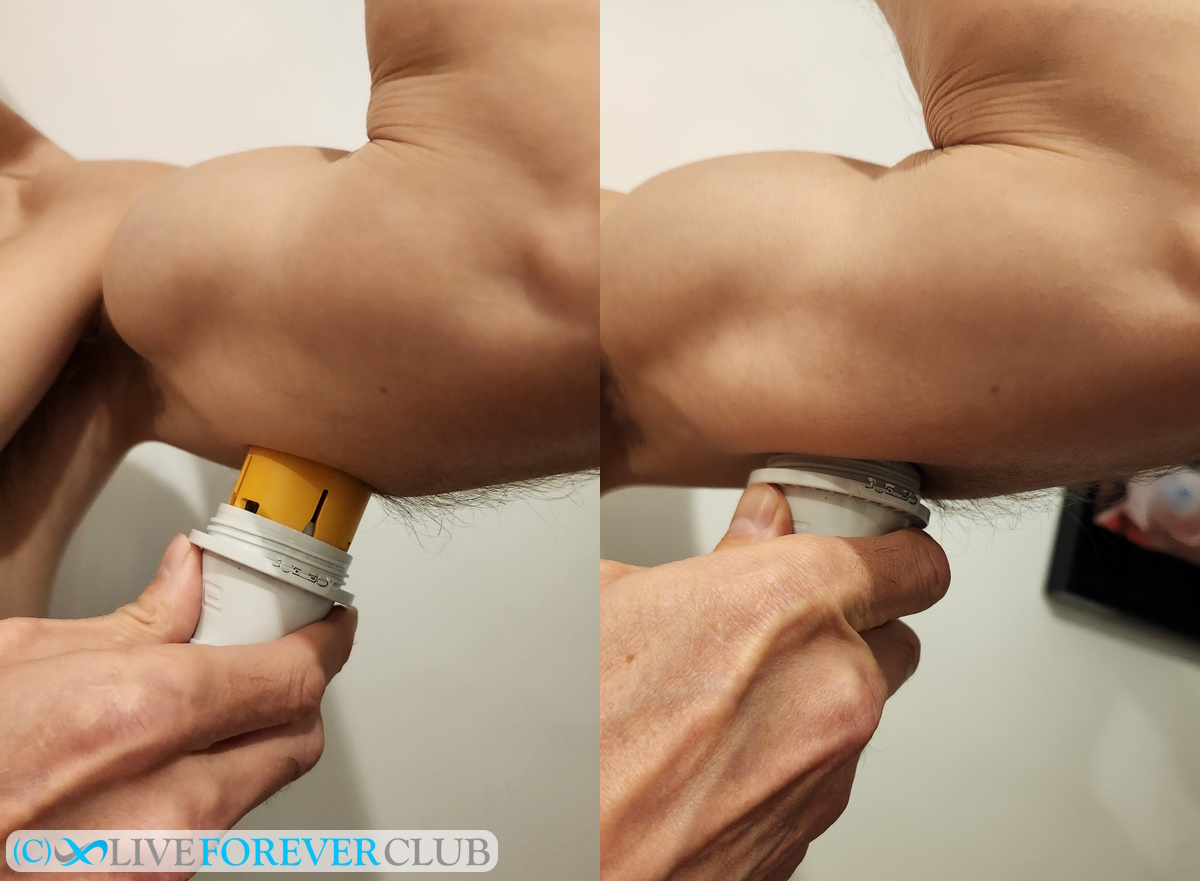
All you have to do is remove the cap and push it firmly onto your arm, no pressing a button or anything, it’s fully automatic. I found I needed to wiggle the applicator a bit to remove it, but it was all pretty simple.
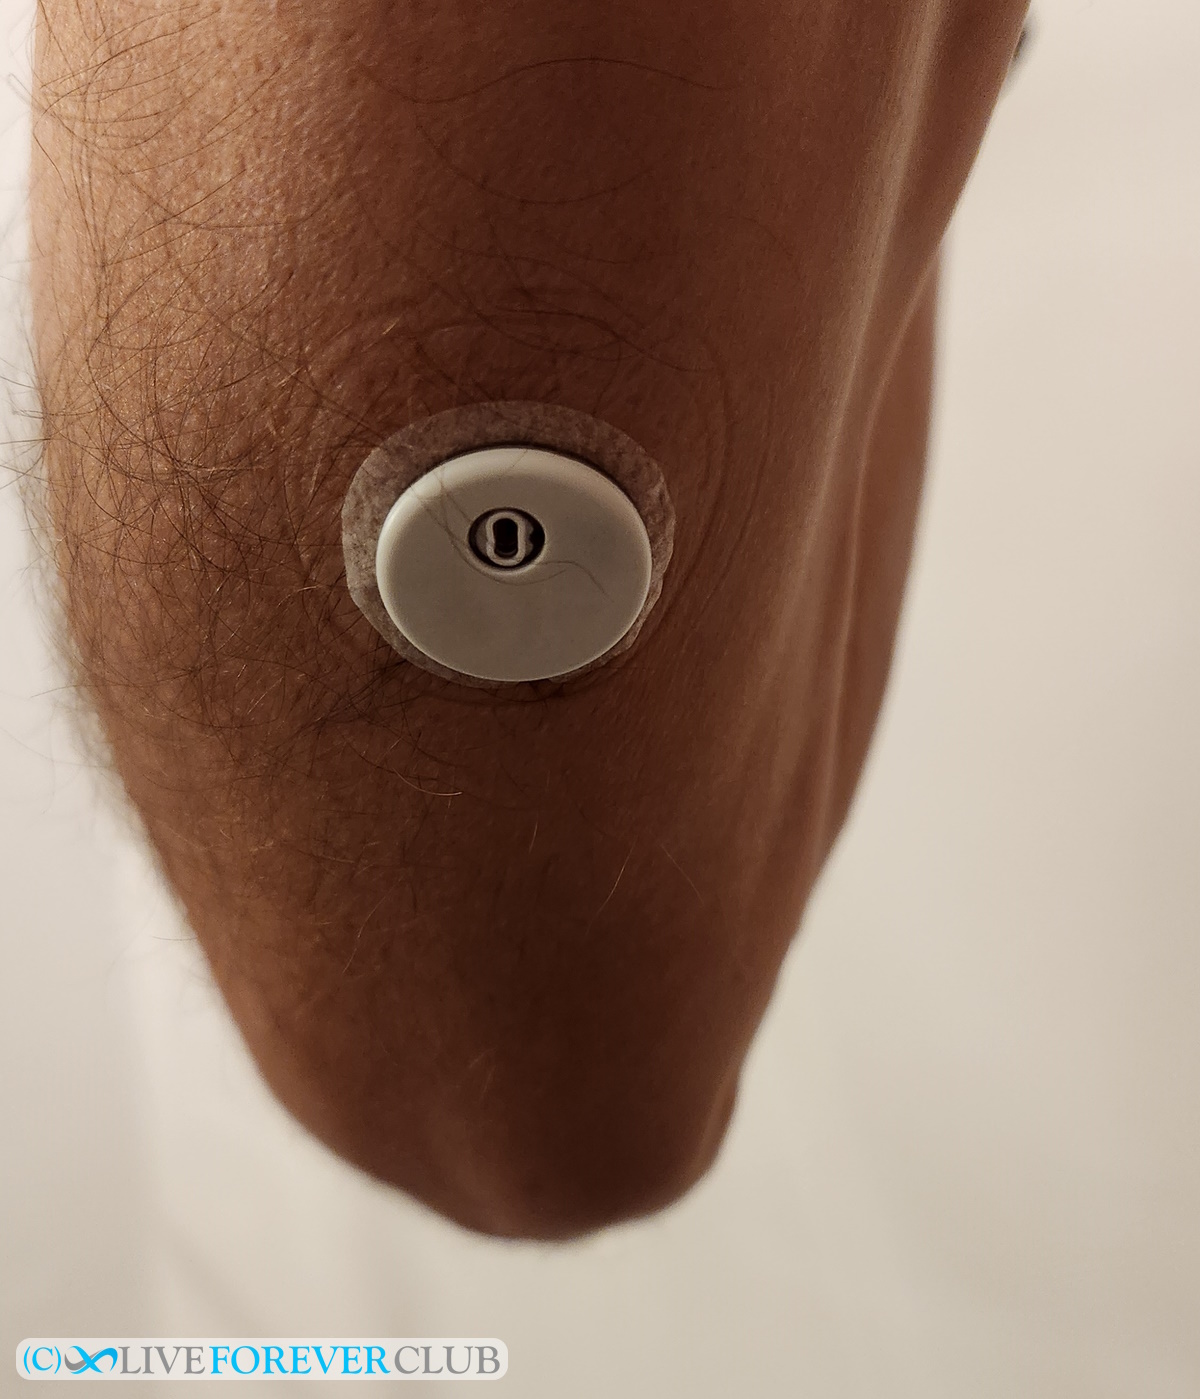
Once it was in, I didn’t notice it at all, apart from occasionally catching it when taking my t-shirt off. But apart from that, I couldn’t feel it, including when sleeping on that side.
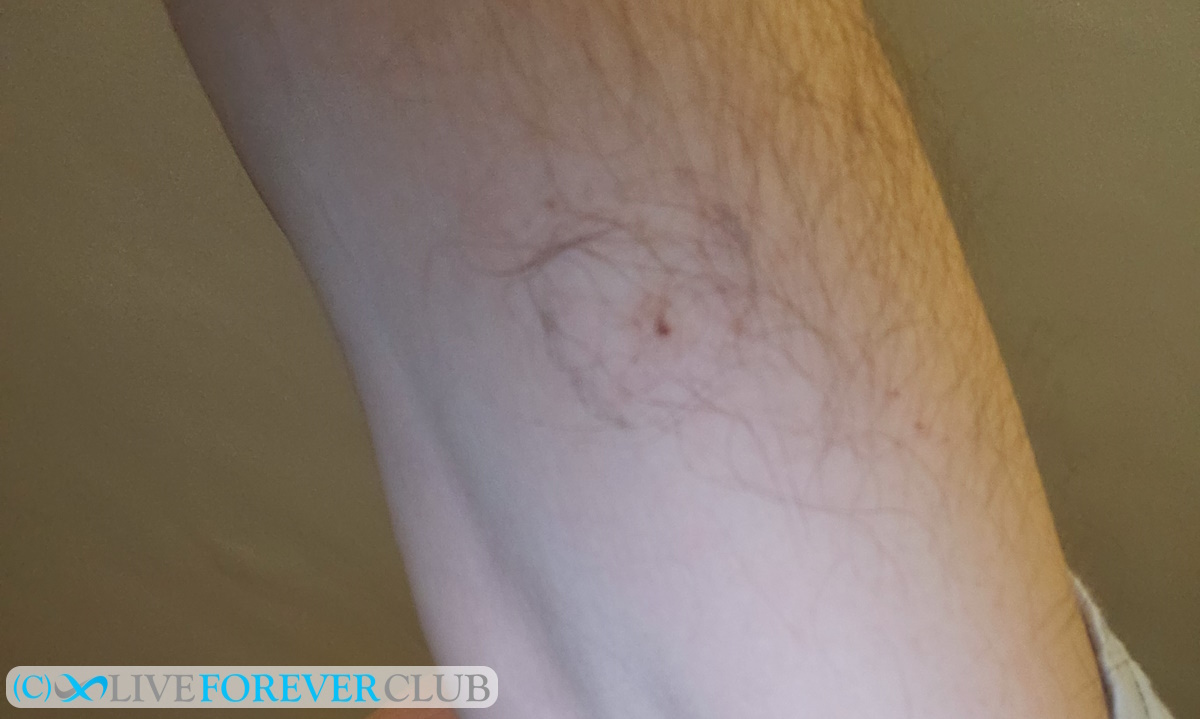
Jumping ahead, removing the CGM sensor was just as easy. I just slowly peeled the adhesive ring off (people with hairier arms might take a bit more care!) and pulled it straight out, without worrying about whether the needle was going to come out at an angle. As the photo below shows, it barely left a mark. Perhaps if I was going to apply another device immediately afterwards, I might swap arms, but I don’t think it’s necessary to.
Freestyle Libre App
Kudos to the app development team for making connecting to the sensor so easy. Just download the app, open it, and when on the home screen simply hold the phone to the sensor – no Bluetooth pairing or selecting from a list, it worked perfectly.
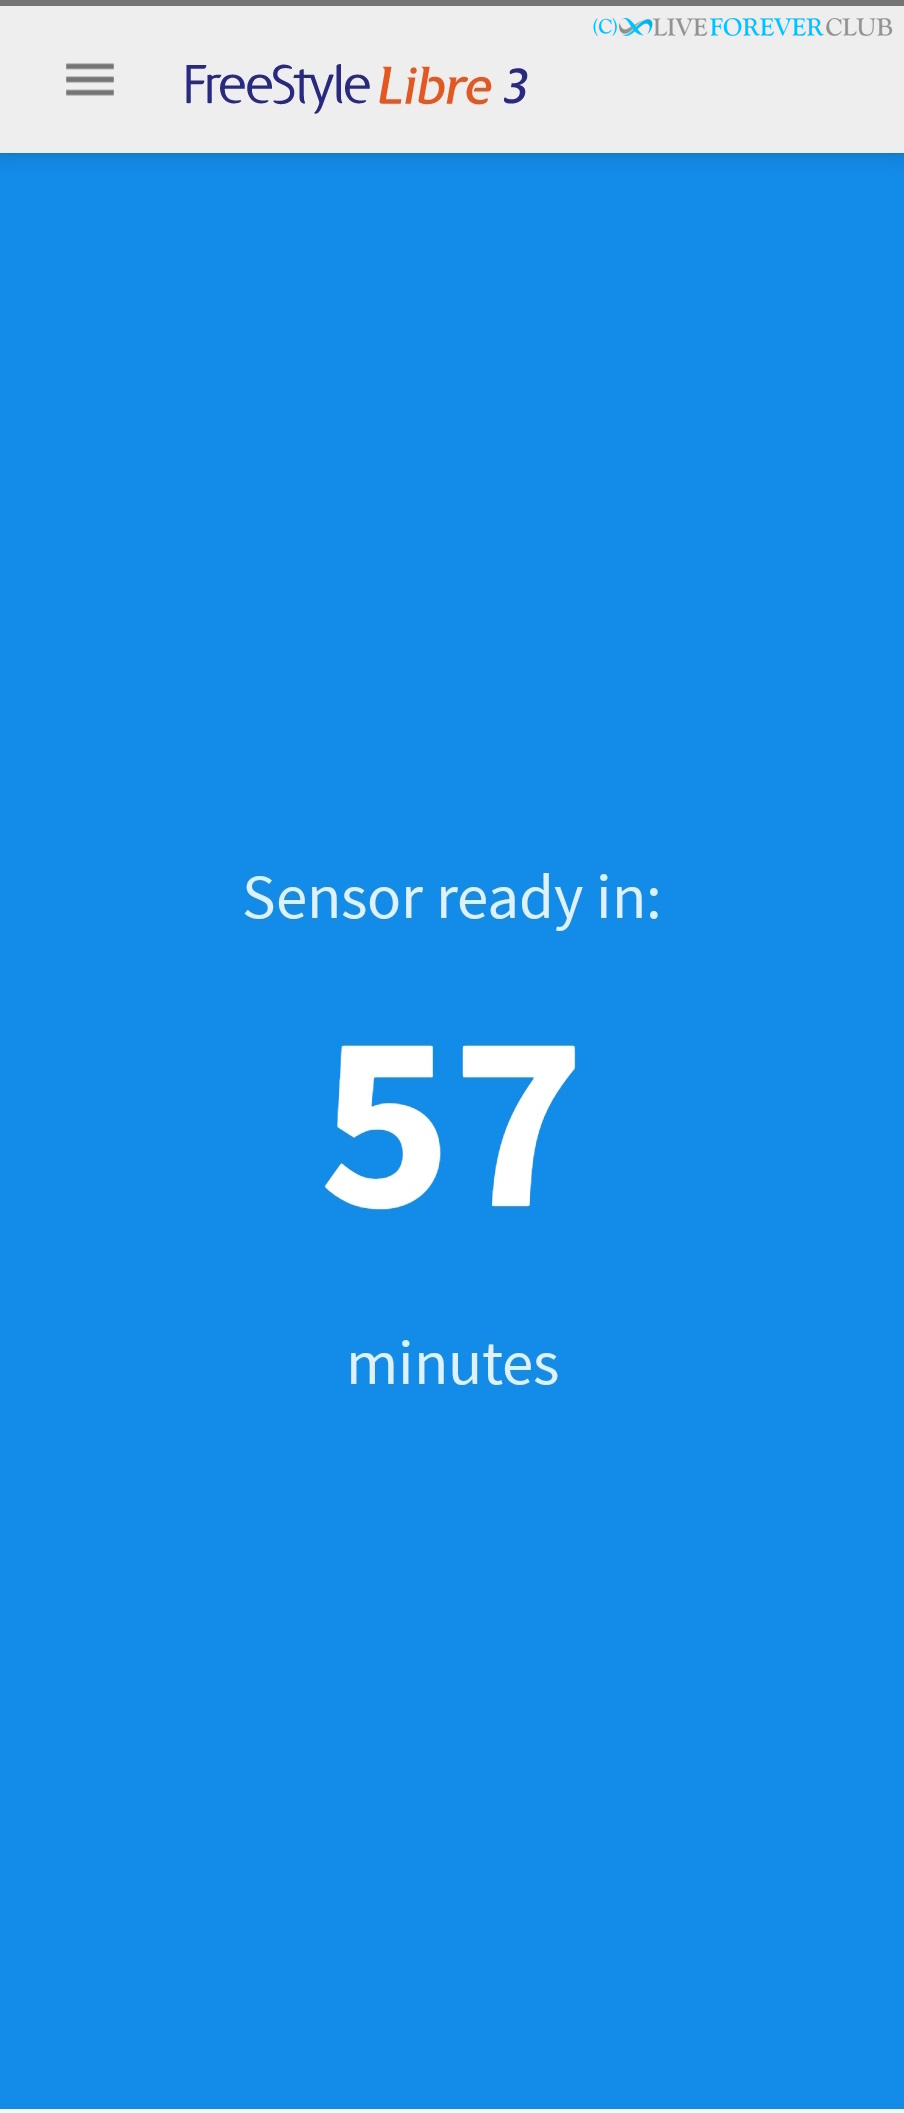
If you’re a bit in patient then the next hour will hurt, because the sensor takes 60 minutes to calibrate. The app displays a countdown timer while you’re waiting, and as you can see I was already checking 3 minutes later!
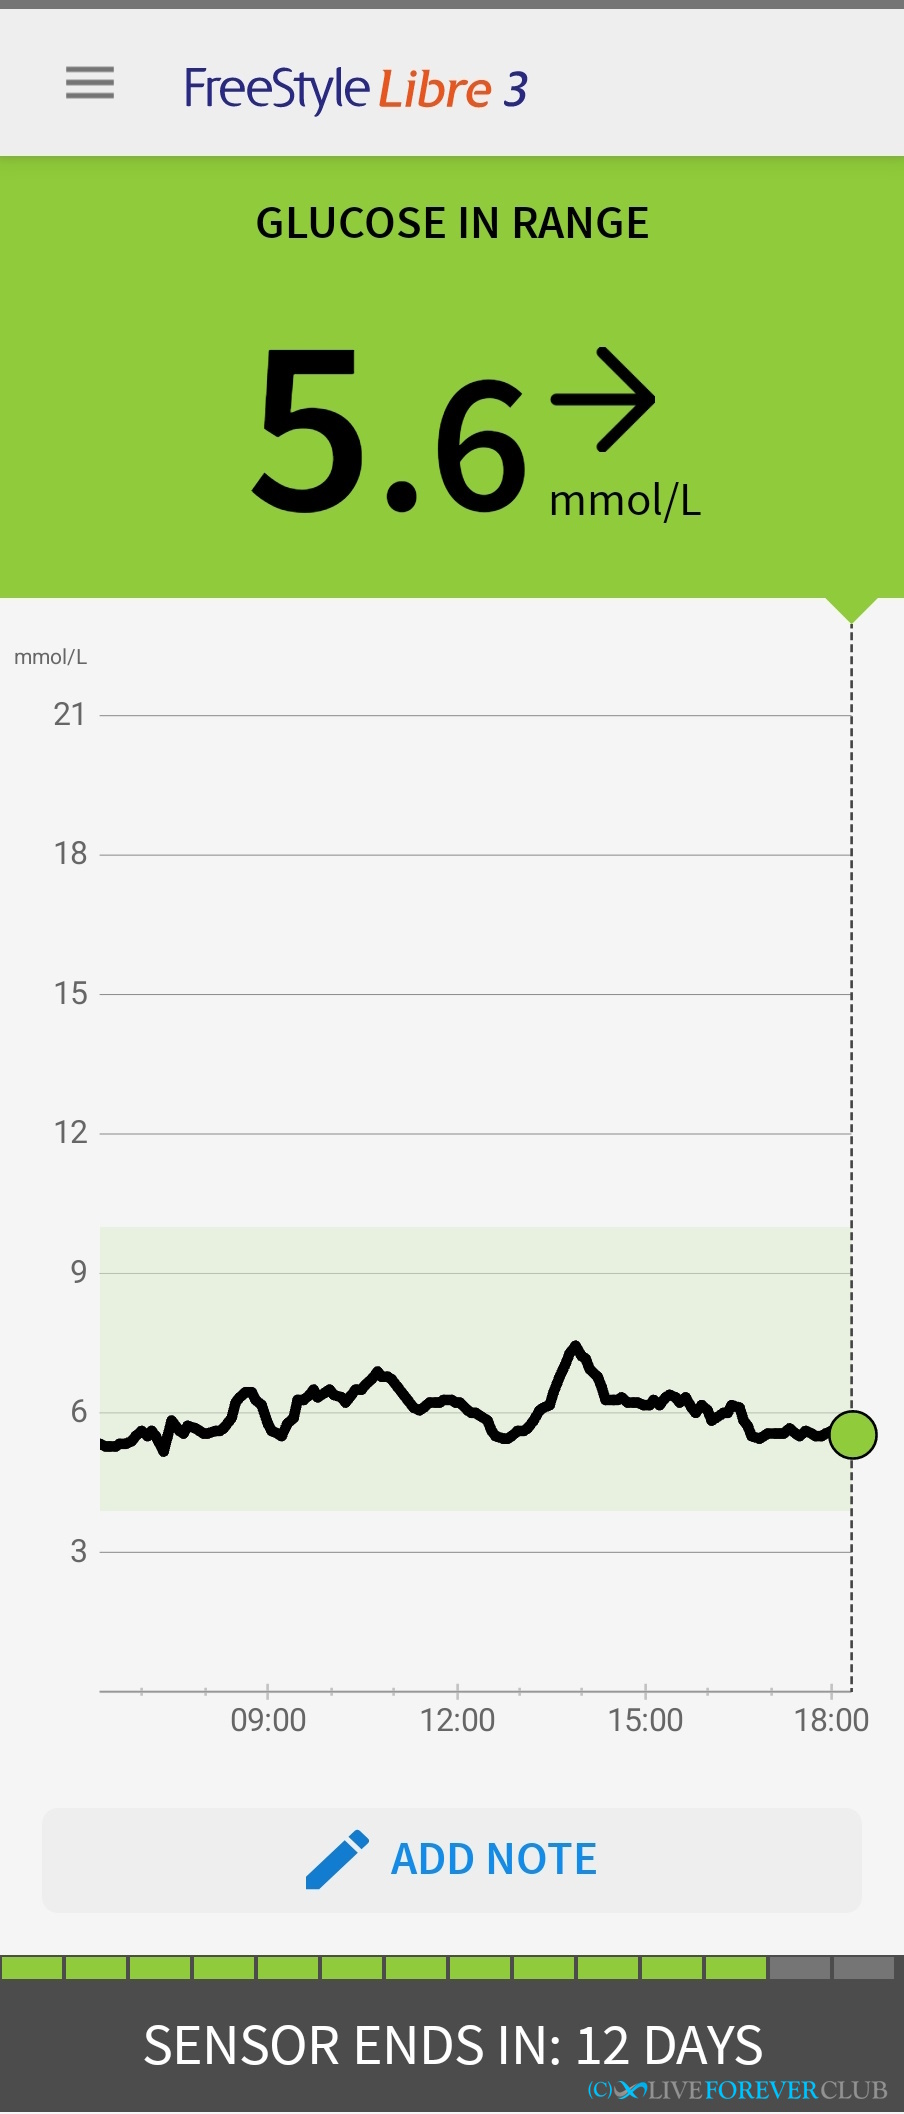
Once up and running, the default screen is the interesting one.It shows your blood sugar level over the previous 12 hours, and, with that, you can check how what you have eaten has affected your blood glucose levels, so this is the key report you need.
Here’s an example, showing a few standard traits for me:
- the lowest value before I wake up
- a slight rise even before breakfast (something called the dawn phenomenon)
- a small peak after breakfast
- a slow rise from mid-morning (probably due to mid-morning snacks)
- a larger peak after lunch
- a steady decline throughout the afternoon (prior to a large peak after dinner, not shown)
One missing feature from the app is the ability to select a point on the graph to check the reading. It would be really useful to have a slider bar which you could line up with a peak to check the time and reading at that point.
There are plenty of other charts and reports which I might delve into more next time, including ones that I don’t know the meaning of (for example, Glucose Management Indicator, GMI, which was 5.9% - so perhaps an HbA1c equivalent). I’d have to study the built-in reports in more detail, particularly to check their granularity, as the “time in ranges” report shows me as in range (3.9-10.0) for 100% of the time, though I know I peaked over this occasionally – but maybe less than 1% of the time so isn’t shown. (NOTE: just checked, I was only above 10.0 for 10 minutes during the 2 week period so I think this is reasonable rounding). As I say, you could spend a lot of time playing with the app.
I decided to do some of my analysis in Excel. So, first, I had to export the data. This was the only limitation of the app that I came across – I couldn’t just email it to myself (like notes from my Kindle app) but had to register for an account on the LibreView website, sync my app, and then download a CSV file from the website. Not difficult, but a little bit of extra work.
Checking my continuous glucose monitor results
I’m not a diabetic and definitely not a blood glucose expert, so I’ve tried to check the key performance indicators that might tell me whether I should go see a doctor. As with everything in biology, these indicators get more complex the closer you look, with more exceptions and interactions with other biomarkers, so probably best to get reviewed by a skilled clinician if you have any concerns about your own results.
How to convert UK to US blood glucose units
Being based in the UK, I’ll be referring to blood glucose measurements in mmol/l (millimoles per litre). However, other countries, particularly the US, use mg/dL (milligrams per deciliter). Fortunately, there is an easy conversion factor.
To calculate mg/dL from mmol/l: mg/dL = 18 × mmol/l
For example, 3.9 mmol/l = 18 x 3.9 = 70 mg/dL
And the other way around, for Brits wanting to convert US units back to UK…
To calculate mmol/l from mg/dL: mmol/l = mg/dL / 18
For example, 100 mg/dL = 100 / 18 = 5.6 mmol/l
Target blood glucose ranges
Before I start looking at my results, it’s important to know what the target blood glucose levels are. These vary depending on whether you are trying to manage diabetes or, like me, are a non-diabetic tracking blood glucose as a preventative measure.
According to Diabetes.co.uk, for the majority of healthy individuals, normal blood sugar levels are:
- Fasting glucose between 4.0 to 5.4 mmol/l (72 to 99 mg/dL)
- 2 hours after eating (postprandial) up to 7.8 mmol/l (140 mg/dL)
- Random (so including shortly after eating) below 11.1 mmol/l (200 mg/dl)
Prediabetic values, which means not officially diabetic but you’d better start taking action, are:
- Fasting glucose between 5.5 to 6.9 mmol/l (100 to 125 mg/dL)
- 2 hours after eating (postprandial) between 7.8 to 11.0 mmol/l (140 to 199 mg/dL)
- No random value given for prediabetics – but above 11.1 mmol/l is considered diabetic.
Readings higher than the prediabetic ranges means you have full-blown diabetes and are hopefully already managing it with your doctor.
Fasting Glucose Result
Fasting Glucose measures the level of glucose in the blood after an individual has not eaten for at least 8 hours. Prior to the popularity of HbA1c, fasting glucose was the typical value to check in a blood test panel.
I took the first reading after 7:00 a.m. from my downloaded spreadsheet to check the range of my fasting glucose over 2 weeks.
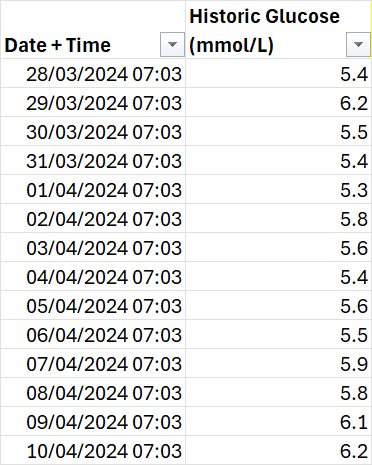
- Minimum = 5.3 mmol/L
- Maximum = 6.2 mmol/L
- Average = 5.7 mmol/L
Out of 14 readings, only 4 were within normal range, with the average putting me at the lower end of prediabetic. Fortunately, no reading went into the diabetic range.
Before Medichecks started reporting HbA1c, I had 3 fasting glucose results between 2009 and 2018 which were pretty consistent at 4.90 +/ 0.1 mmol/l. So, it’s surprising that it has jumped from 4.9 to 6.2 in 6 years given no significant change to my diet or lifestyle, but something I will take seriously as an early warning signal.
Postprandial result
Prandial (adjective) = relating to meals or eating
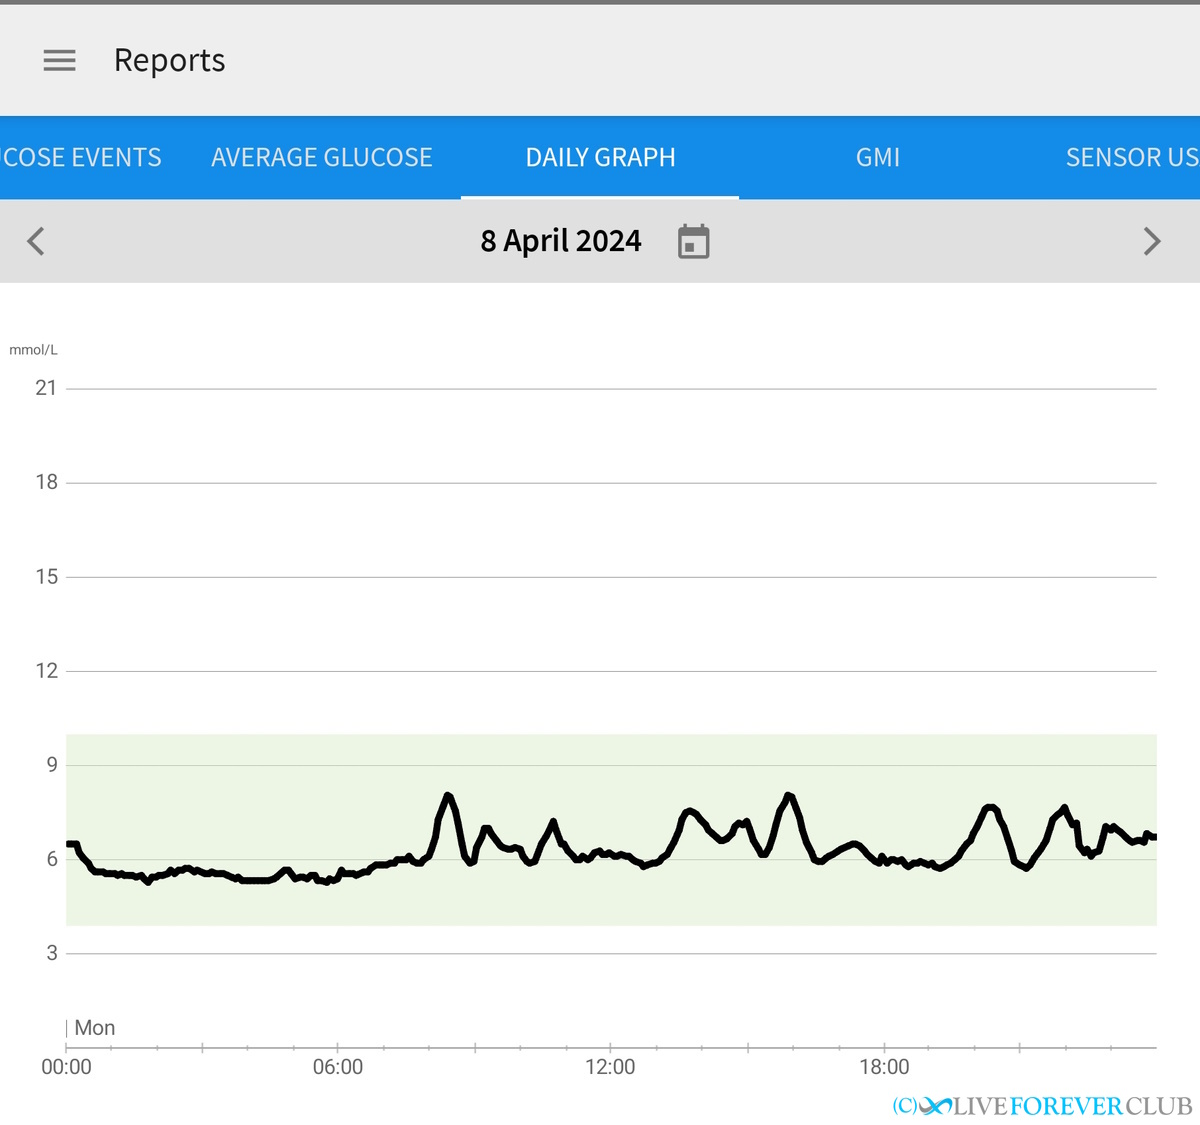
Postprandial (sometimes written “post prandial”) readings are typically 90 mins to 2 hours after a meal, so that the insulin response has had time to do its thing and control the amount of sugar in your blood. To measure this value, you’ll have to make sure you have a clearly defined mealtime – meaning no snacks for a couple of hours either side, that way you’ll be able to identify the immediate spike after eating and see how the curve drops back down (and possibly oscillates) over the new few hours.
Checking my results by eye, in most cases the value is back down below 7.0, occasionally nearer 8, but equally likely nearer 6. So on this measure I’ll give myself the benefit of the doubt and say I’m in the normal range – but still borderline prediabetic, albeit the right side of the border this time.
I also noticed that often my graph bounced a couple of times after a meal, as in I saw one peak followed by one or more smaller peaks. According to the metabolic health company, Levels, these “biphasic” (two phases) curves after a large glucose load are generally associated with better health outcomes.
Someone mentioned to me that coffee (which has no glucose if drank black) seemed to trigger a glucose response, but I wonder now whether they were confusing a biphasic curve with a post meal coffee triggering a secondary glucose peak.
Random Blood Glucose
I didn’t perform a random sampling of my results, but instead checked to see how often I broke the 10.0 limit – this only happened once - for a 10-minute period after one dinner. Never did I go over the 11.1 mmol/l diabetes threshold.
Bringing the target down a notch, to 9.0 mmol/l, I only exceeded that 3 times (again very briefly) in the 2-week period. There isn’t a prediabetic range for random blood glucose levels, but as I rarely get within 20% of the diabetic threshold this looks like a good result for me.
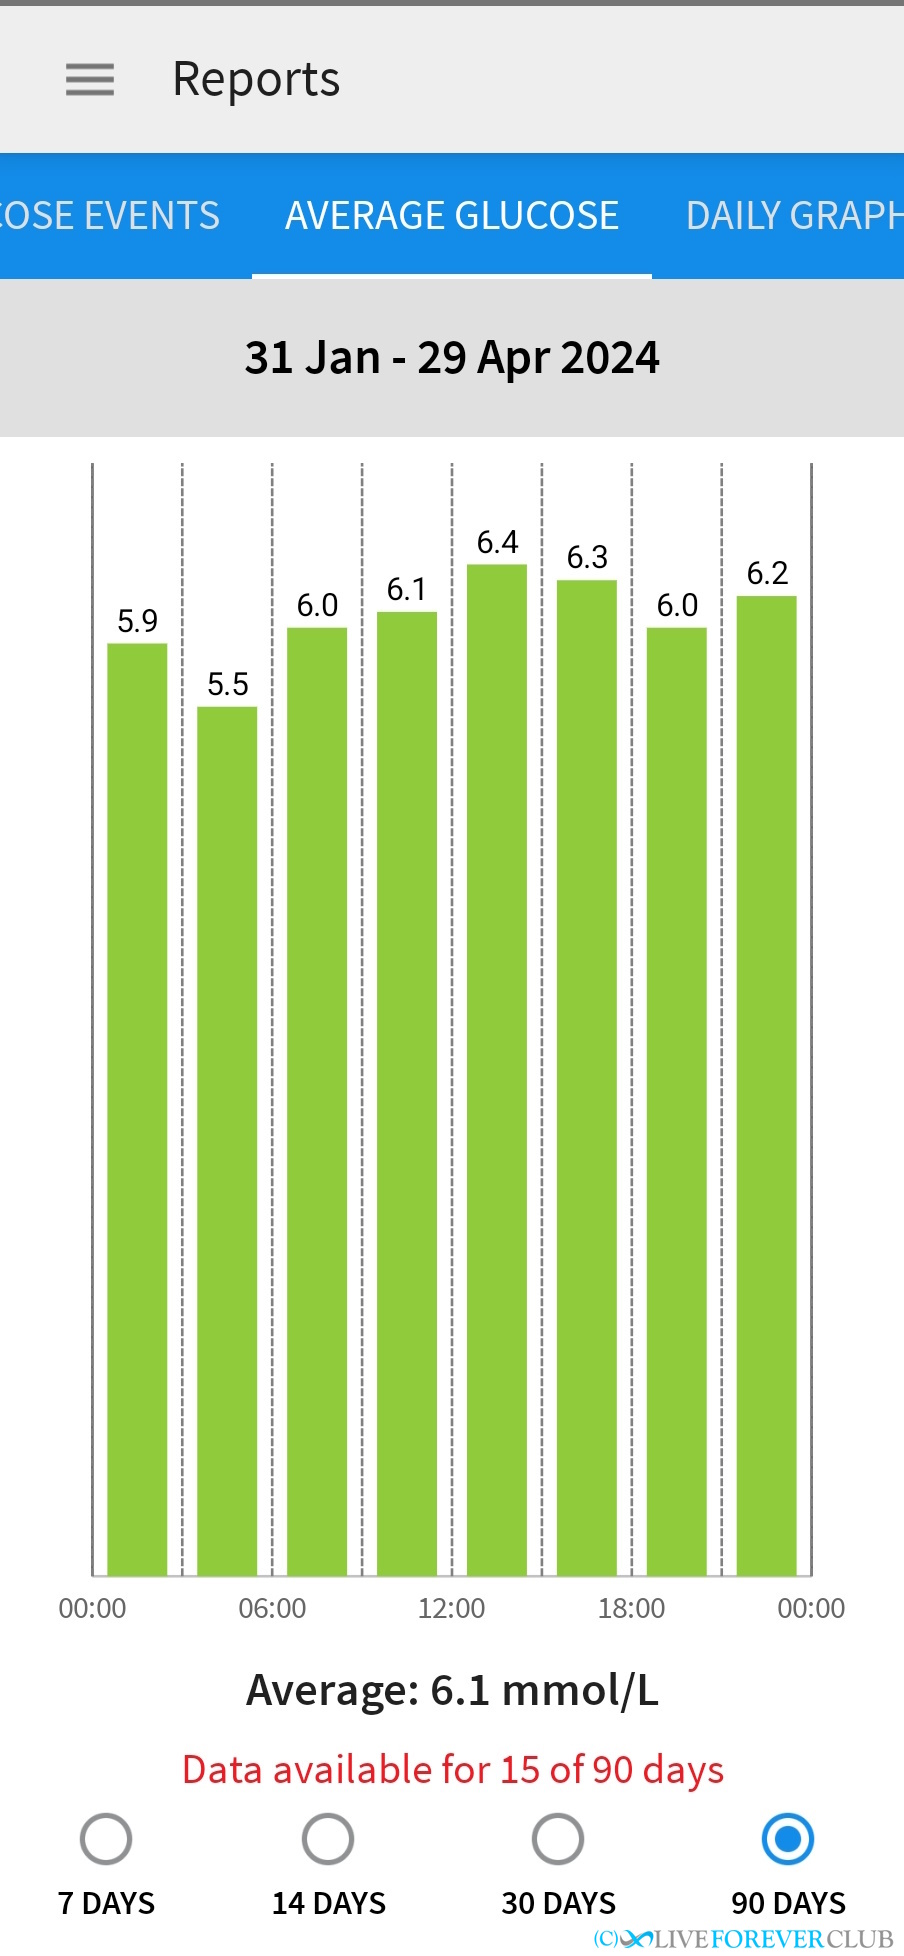
Average Blood Glucose
The average blood glucose measurement ignores all of the peaks and troughs of the CGM graph (or, at least, smooths them out) and gives the average level of blood glucose over the sensor period – mine was 6.1 mmol/l. To add a bit more detail to this value, a graph is available that breaks the average into 3-hour segments.
Before CGMs were available, HbA1C tests were used and they still the standard way of measuring average blood glucose levels. The HbA1c test doesn’t measure blood glucose directly, instead it looks at what percentage of haemoglobin molecules in the blood that have bound with glucose. As red blood cells only last around 3 months this provides an average over that time.
According to Healthline, a normal A1C level is below 5.7%, which corresponds to an estimated average blood sugar level lower than 6.5 mmol/l (117 mg/dL), and prediabetes indicated in the range of 5.7% to 6.4% (6.5 – 7.6 mmol/l).
Looking back at my annual blood tests, for the last 7 years, my HbA1c has averaged 5.4% with little variation. This is the equivalent to 6.1 mmol/l so an exact match with this 2-week CGM test, with showing me reasonably safely below the prediabetic threshold.
If you want to convert your HbA1c to blood glucose, or vice versa, then Diabetes.co.uk have a useful calculator here: https://www.diabetes.co.uk/hba1c-to-blood-sugar-level-converter.html
Conclusion
The key reason to monitor blood glucose levels is to allow you to manage your diet and lifestyle to, hopefully, prevent you becoming diabetic, or even pre-diabetic. We all know sugar is bad for us, but sometimes it takes a graph of YOUR sugar levels reacting to YOUR diet to really hammer it home. It did for me.
My results are a mixed bag with fasting glucose poking into prediabetic range and other measurements just outside. Maybe looking at this, it means my immediate insulin response is good at keeping my blood glucose below dangerous levels, but doesn’t work well enough to keep it low enough for long enough.
Similar to a diabetes diagnosis, it’s not that there is a sudden step change to your health as you pass the threshold, there is a continuous spectrum of worsening health. Therefore, it doesn’t really matter if I’m just below, or just above, the prediabetic diagnosis level. Either way, it means it’s time to take action to prevent my glucose levels rising into a hazardous zone.
Although some clinicians are against non-diabetics using CGMs (concerned that people may over worry about out-of-range blood glucose levels) I found it to be a fascinating introduction to how my body reacts, in real-time, to food I’m eating , and has shook me out of the illusion that being fit and being the right weight, do not mean everything is healthy under the hood.
Overall, a fascinating and informative exercise. So much so that I’d be interested in having another go at some point. This first time I was monitoring the overall scores, but in future it would be good to do some food comparisons such as eating rice versus potatoes for dinner, eggs vs cereal for breakfast, and even how time restricted eating would affect my blood glucose.
Mentioned in this blog post:
Click on resource name for more details.

Adrian Cull
Longevity advocate - founder of the Live Forever Club and author of the Live Forever Manual

Measuring the hallmarks of ageing – how can you track the underlying causes of ageing?